Digital Sales KPIs - Guide to measuring your sales performance

After the enormous success of our Digital Marketing KPIs Guide, here comes the sequel for all salespeople. In sales, too, it is essential to measure all metrics in order to distinguish good from bad activities.
In this guide, salespeople will get an overview of the most important metrics and KPIs in sales to support their decision-making processes and identify legitimate opportunities and eliminate time-wasters. If you want to learn more about inbound sales and social selling in advance, we recommend our Digital Sales Guide (only in German).
Don't have time to read through the whole manual? Then download our free guide:
Inhaltsverzeichnis
What are sales metrics?
Sales metrics are measurements that represent the performance of an individual, team, or company. Sales leaders use these metrics to achieve their goals, prepare for growth in the future, adjust sales compensation, award incentives and bonuses, and identify problems with their sales plans and goals before they arise.
Difference between KPI & Key Figures
The term KPI means Key Performance Indicator. KPI is often mistakenly used as a synonym for the term key figures. This usage is only partially correct and requires a more precise definition.
Key figures and KPIs differ in terms of their informative value. The informative value of a key figure is usually generally valid, which is why the same key fugure can also be compared between different companies. KPIs, on the other hand, are used to measure the important objectives within a company. KPIs are therefore individually oriented key figures for measuring a specific corporate goal and thus represent key indicators for measuring success.
For example: Your corporate goal is to increase sales. This results in the marketing goal of generating leads, which in turn results in the sales goal of acquiring new customers. For example, the KPI in marketing would be lead generation, and a key figure from this would be the number of downloads on landing pages. In sales, the KPI would be the new customer generation and a key figure from this is the number of new customers.
Therefore, to achieve success, it’s important to define no more than one to two KPIs per area. The key figures that are measured in this way are used to draw recommendations for action and conclusions, which in turn should help to achieve the KPIs.
KPI Dashboards - Tools to measure your data
Once the key figures and KPIs have been selected, they should be measured and reviewed at regular intervals and adjusted if necessary. There are many ways to do this. We will show you different KPI dashboards that are not only useful for your marketing.
Important: The goals and the measurements must always be carried out with the same tool, otherwise they are not meaningful! At BEE Inbound, for example, we recorded a difference in total traffic (sessions) of 19.3% between HubSpot and Google Analytics for the period of 2018 because the data of these tools are recorded differently.
We measure ourselves by results, just like you. That's why we focus everything on performance! We link inbound with performance.
Possible KPIs in Inbound Sales - Part 1
MQL
- Leads
- SQL
- Opportunity
New customers
- New Customer Acquisition Cost (CAC)
- Net profit per new customer
- Payback period for customer acquisition costs
- Average deal size
- Win-loss rate
- Revenue by product
- Customer Lifetime Value (CLTV)
- CAC-to-CLTV
Existing customers
- Customer retention rate
- Sales churn
- Net Promoter Score (NPS)
- Increase in sales to existing customers
Leads
Marketing Qualified Leads (MQL)
Leads are divided into Leads, Marketing Qualified Leads (MQL) and Sales Qualified Leads (SQL).
What an MQL and an SQL is, each company has to define for itself. They depend on the buyer personas and a prospect fit matrix. With good lead nurturing, a lead becomes an MQL, which in turn becomes an SQL. This requires suitable content produced specifically to meet the challenges of the buyer persona.
Sales qualified Leads (SQL)
An SQL is a contact who has developed a genuine buying interest. On its way from the MQL to the SQL, its interest in a particular topic has been aroused to such an extent that personal contact is pending. At this point, the method should already be defined and known to the sales department. With a suitable automatic task creation, this action can be taken promptly.
Examples of direct queries that define a contact to the SQL:
- Demo Request
- Direct contact request
- Offer request
- Concrete service request
Opportunity
Every SQL that is processed by a sales representative and shows clear interest in a service or product of your company becomes an opportunity in the next step. This is the phase between being contacted by your sales force, contract negotiations, and the final purchase or loss of contact.
Possible KPIs in Inbound Sales - Part 2
New customers
Number of new customers
Here you determine how many new customers your company has acquired in a specific time period in a particular region. Of course, this can also be broken down per team or employee. You get an overview of which region or which team was particularly successful and where you should deploy more or fewer employees.
New customer acquisition costs (CAC)
What is it exactly?
The CAC (Customer Acquisition Cost) figure shows the average total costs that the company spends on acquiring new customers through acquisition.
How is this calculated?
To determine the CAC, the total sales and marketing expenses within a defined period are divided by the number of new customers acquired in the same period.
What does it mean and why is it important?
The lower the CAC, the better. If the calculated value increases, this shows that proportionally more had to be spent on each new customer acquisition. You should analyse the effectiveness of the measures and the efficiency of sales and marketing in this case.
Net profit per new customer
What does a new customer generate? Calculate the net profit generated per new customer or per specific period of time, for example, per month or per quarter. You need this value to subsequently derive the payback period for customer acquisition costs.
Payback period of the costs for customer acquisition
What is it exactly?
Payback time is the amount of time in months it takes for a company to recoup the money invested in new customer acquisition.
How is this calculated?
Divide the CAC by your net profit per month based on your average new customer. The result shows the payback period in months.
What does this mean, and why is the key figure important?
Only when the cost of customer acquisition is amortised do you make money from your new customers. The less time it takes to pay off the CAC, the better. In industries where revenue is largely generated by monthly or annual fees, the payback period should be less than 12 months.
Average deal size
What is it exactly?
A monthly or quarterly look at this metric shows whether the company's own contracts are increasing, decreasing or staying the same. Depending on the company's goal, different values need to be achieved here.
How is this calculated?
The average deal size is calculated by dividing the total number of deals by the total amount (CHF) of these deals.
What does this mean, and why is the key figure important?
The average deal size helps to identify potentially high-risk deals.
It also helps to identify salespeople whose average deal size is significantly below or above the average of the team. This is where approaches for training or bonuses can be found.
Profit-loss ratio
What is it exactly?
The win-loss ratio compares the number of deals won with the number of deals lost.
How is this calculated?
To calculate this rate, you add up the profits and losses of the deals and divide the number of profits by the total number of deals.
What does this mean, and why is the metric important?
Ideally, the percentage of business won should grow over time. Furthermore, the reasons for lost business can be compared.
Revenue by products
What is it exactly?
The purpose of analysing revenue by product line is to provide the sales team with certainty about the popularity and profitability of products and services within a given time period.
How is this calculated?
Total revenue is divided among the individual product lines, and the figures are then compared.
What does it mean, and why is the metric important?
This analysis can be shared with the company's product and marketing teams to better understand which products and services need to be improved or promoted.
Customer Lifetime Value (CLV)
What is it exactly?
Customer lifetime value is the amount of revenue that an average customer provides to a company before they end their customer relationship.
How is this calculated?
There are different equations for calculating CLV. For our purposes, we will use the simple CLV formula to multiply the average annual sales by the average lifetime of a customer.
What does it mean, and why is the key figure important?
The CLV shows companies how much revenue they can expect from a customer over the course of the business relationship. The longer a customer stays with a company, the greater its lifetime value. Customer care directly influences the business relationship with the customer. It plays a key role in solving problems and offering recommendations that encourage customers to remain loyal to a company or switch.
CAC-to-CLV
What is it exactly?
This figure compares the cost of acquiring a new customer with the revenue the customer will generate over time.
How is this calculated?
The CAC is subtracted from the CLV.
What does this mean, and why is the metric important?
It helps companies identify if customers are churning before they start contributing to the company's bottom line. Sales teams can use this information to determine better pricing strategies and to better position their products in the sales process, thus reducing churn.
Possible KPIs in Inbound Sales - Part 3
Invetory Customers
Kundenbindungsrate
Customer retention rate
What is it exactly?
Retention rate is a metric used to see how many customers have stopped coming to the store or have cancelled their membership, subscription or customer support.
How is this calculated?
The number of customers at the end of a period is subtracted from the number of customers at the beginning of the period. From this result, the number of new customers is divided.
What does this mean, and why is the key figure important?
A low churn rate is good. It means that most customers and prospects are satisfied.
Revenue churn
What is it exactly?
Revenue churn shows how much revenue was lost in a given period.
How is this calculated?
First, the Monthly Recurring Revenue (MRR) at the end of the month is subtracted from the MRR at the beginning of the month.
Next, you have to subtract any sales that were generated by upselling or cross-selling to existing customers.
Finally, divide this number by the MRR you had at the beginning of the month. You may end up with a negative percentage. This means that the revenue generated by existing customers outweighs the losses.
What does this mean, and why is the key figure important?
For subscription-based companies, this is an important metric to calculate. When there is churn, it is quite possible that some customers are about to terminate a relationship and the service team needs to take quick action to prevent this.
Net Promoter Score (NPS)
What is it exactly?
The Net Promoter Score is used to measure customer satisfaction. The means of choice for measuring this important KPI are standardised customer surveys on satisfaction with the company. The evaluation is carried out by assigning a point value between 0 and 10.
If the rating is 9 or 10, the customer is classified as a Promoter. Customers who rate your company at 7 or 8 are considered Passives. The values from 0 to 6 are Detractors.
How is this calculated?
Net Promoter Score Was ist das und welchen NPS-Wert gilt es zu erreichen-1
What does this mean, and why is the key figure important?
Customer satisfaction and customer loyalty are extremely important for the long-term success of a company. The Net Promoter Score provides information about the value your company achieves here. The NPS can reach values between -100 and +100. If the score is above 0, your company has more promoters than detractors. The higher the value is above 0, the better.
After all, you have to spend six to seven times as much on acquiring a new customer as you do on retaining one. It is, therefore, extremely important to keep existing customers happy. Keep in mind that a happy customer will gladly consume further offers from your company or increase the budget he invests in your services. And they will be happy to recommend your company to others.
Increase in sales to existing customers
What is it?
Your customer spends more money on your products or services. Excellent! You need to measure this increase in sales over a specific period of time. For example, the difference in sales can be determined in relation to the previous year, the previous quarter, etc.
How is this calculated?
Calculation of the comparative period "year":
Sales year XY - Sales previous year = Sales increase
What does this mean, and why is the key figure important?
An increase in sales indicates good customer satisfaction. However, even a minus value does not necessarily mean dissatisfaction. This is because the market situation has a strong influence on customer investment. A highly satisfied customer would perhaps gladly invest more budget with you; the economic situation of its enterprise may not permit this, however. Brand dependency can also play a role. Depending on the industry, it can be so great that it is not worth switching despite dissatisfaction with your competitor.
You want to start calculating your KPI right away? Then put the pen and paper aside. We have something for you that will save you an incredible amount of time:
Improve your sales efficiency easily!
Inbound Sales Key Figures
|
Key figure |
Explanation & Meaning |
|
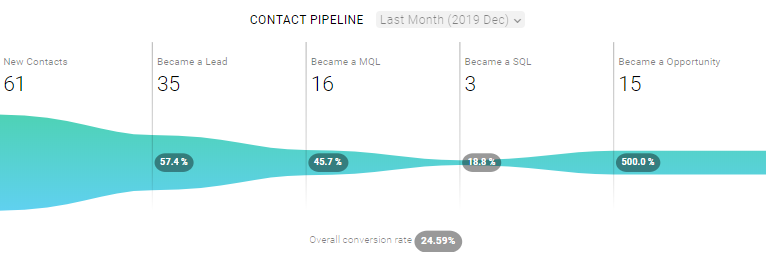
Conversion rates of the funnel by stage |
With the conversion rates, conclusions can be drawn about the quality of the leads, the nurturing and also the work of the marketing and sales teams. If the conversion rate from MQL to SQL is very low, there is a risk that the teams are not working well together or that the leads are not sufficiently qualified.
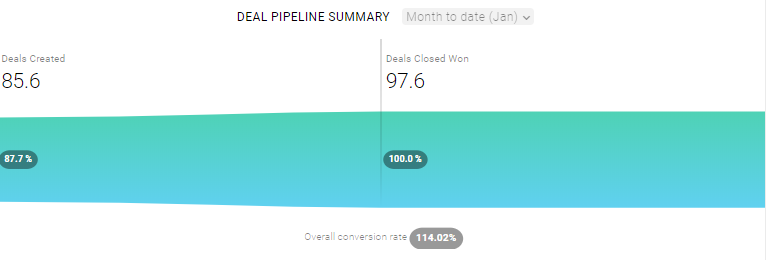
If you have a very low conversion rate from SQL to opportunity, your sales team may not be working effectively enough. The same can be seen in a deal pipeline.
|
|
Number of deals clossed |
How many deals were closed in total or by individual teams or employees? The deal amount can be set in relation to the sales target, and certain benefits can be achieved on the basis of a defined quota. |
| Opportunities according to deal stages |
What opportunities are in the different deal stages in a given period? We will show you what a deal/sales pipeline can look like further down in this guide. |
|
Productivity per employee (PPR) |
How effectively is my sales employee working? Have the set goals been achieved? Based on these figures, the salary can be negotiated - in addition to the fixed portion, a variable portion can be defined. |
|
Tasks |
How many tasks were completed within a certain time frame? |
|
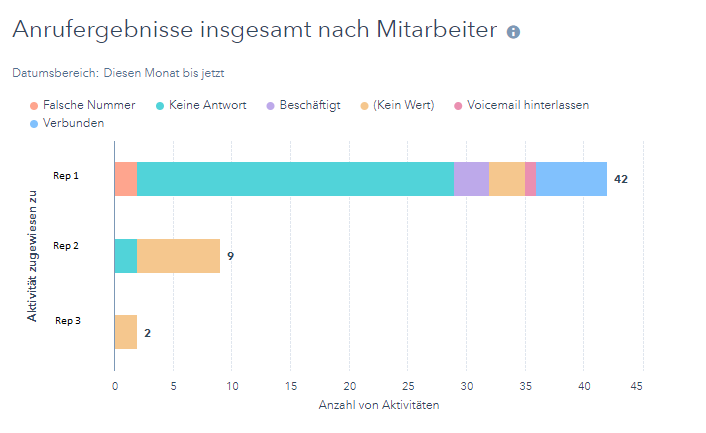
Calls |
|
|
Emails / Sequences / Templates |
|
|
Scheduled meetings and sessions |
How many appointments/meetings were scheduled within a certain period of time? |
|
Meetings and sessions held |
|
|
Demos |
How many demos were performed within a certain period of time? |
| Offers
|
Wie viele Angebote wurden innerhalb eines bestimmten Zeitraumes erstellt? |
You want to improve your sales process and generate more sales? Then you should definitely read this eBook (only in German).

Improve you sales process and generate more revenue
Sales pipeline in practice
The sales pipeline is a systematic and visual approach to selling a product or service and, when combined with a Kanban view, gives a good overview of each deal in your sales workflow.
Since a sale is a classic process, the Kanban method lends itself to this. The design of a sales pipeline is different in every company, but there are commonalities: At the beginning, there is the prospect, who has to be nurtured until an offer can be made to him, which he either agrees to or not. The process is not necessarily linear (especially in negotiations), but there is a beginning and an end.

Become a Top Sales Performer
Putting theory into practice: In 10 weeks you will unleash your full sales potential and perform in the top league.
Conclusion
In digital sales, there are several key figures that help you make your success measurable and show it clearly. The most important thing in the entire analysis process is to focus on the strategically important KPIs and derive the necessary key figures from them. These key figures must then be analysed, and the right measures must be derived from the analysis results.
This Digital Sales KPIs Guide is available for download.
The perfect guide for measuring you sales performance
BEE is a digital growth solution partner
Transform to perform
For mid-market and corporates in the DACH Region that want to transform their business in order to grow locally and globally, BEE is the highest-ranked digital growth solution partner that combines strategy, execution, data intelligence and people in a transformance model.
What BEE stands for
BOOST performance
EXPAND growth
EXCEED expectations
